Rapid A/B-testing with Sequential Analysis
A common issue with classical A/B-tests, especially when you want to be able to detect small differences, is that the sample size needed can be prohibitively large. In many cases it can take several weeks, months or even years to collect enough data to conclude a test. In this post I’ll introduce a very little known test that in many cases severely reduces the number of samples needed, namely the Sequential Generalized Likelihood Ratio Test.
The Sequential Generalized Likelihood Ratio test (or sequential GLR test for short) is a test that is surprisingly little known outside of statistical clinical research. Unlike classical fixed sample-size tests, where significance is only checked after all samples have been collected, this test will continously check for significance at every new sample and stop the test as soon as a significant result is detected, while still guaranteeing the same type-1 and type-2 errors as the fixed-samplesize test. This means the test could be stopped as early as after a handful of samples if there is a strong effect present.
Despite this very nice property, I couldn’t find any public implementation of this test, so I’ve created a node.js implementation of this test, SeGLiR, which can easily be used in web application A/B testing. I’ll give a brief example of usage below, but to give you some idea about the potential savings, I’ll first show you a comparison of the needed samplesize for a fixed samplesize test versus the sequential GLR test.
The test I’ll compare is a comparison of proportions test, which is commonly used in A/B-testing to compare conversion rates. We compare the tests at the same levels, α-level 0.05 and β-level 0.10, and say that we want to detect a difference between proportions larger than 0.01 (in sequential analysis this is usually called an “indifference region” of size 0.01). Note that the expected samplesize for the sequential GLR test vary depending on the true proportions p1 and p2, so we compare the samplesize at different true proportions. We’ll first look at the case where the expected samplesize for the sequential GLR test is worst, when the proportions are closest to 0.5.
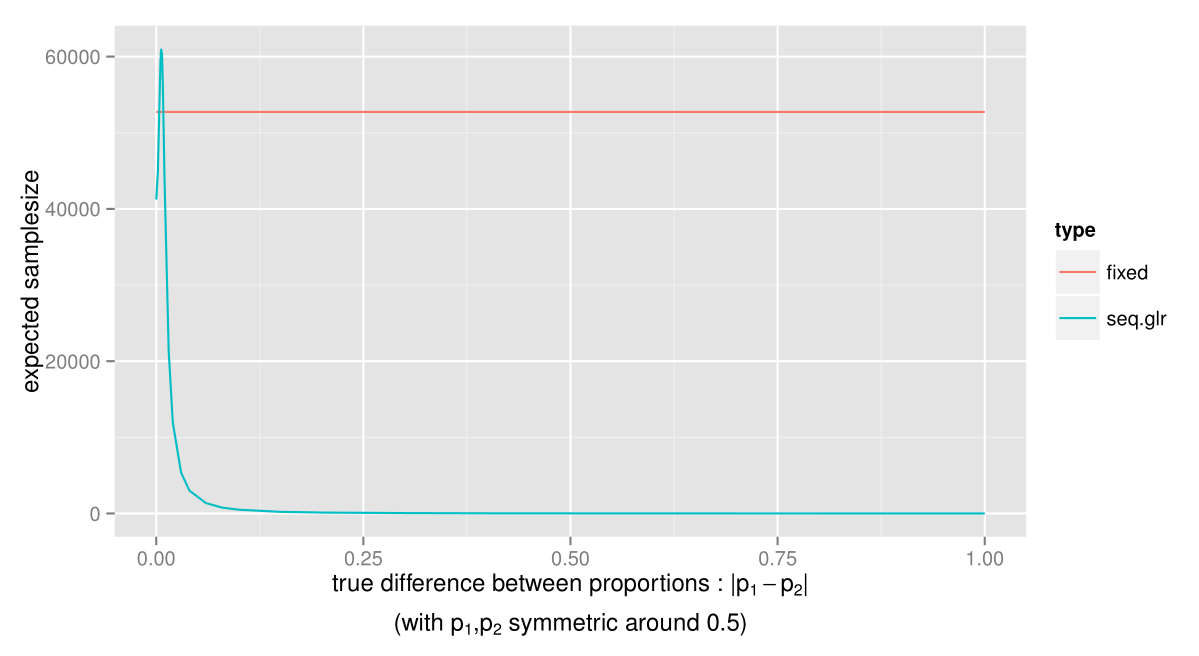
As you can see, the expected samplesize of the sequential GLR test is much smaller for almost any value of the true difference. The test will stop especially early when there is a large difference between the proportions, so if there is a significant advantage of choosing one of the alternatives, this can be acted upon as early as possible. Let’s take a closer look at the expected samplesize when the differences between the true proportions are small.
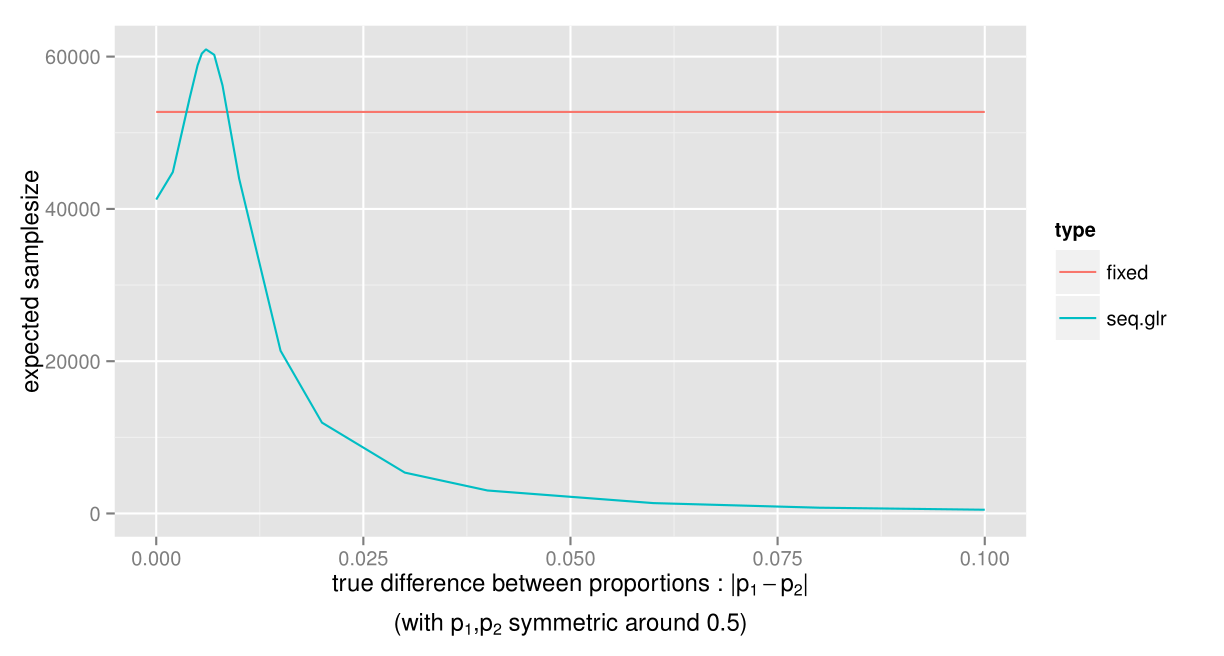
The only case where the sample size for the sequential GLR test can be expected to be larger, is when the true difference between p1 and p2 is just below 0.01, i.e. the smallest difference we were interested in detecting. However, this is just when the proportions are close to 0.5. What about when p1 and p2 are farther from 0.5?
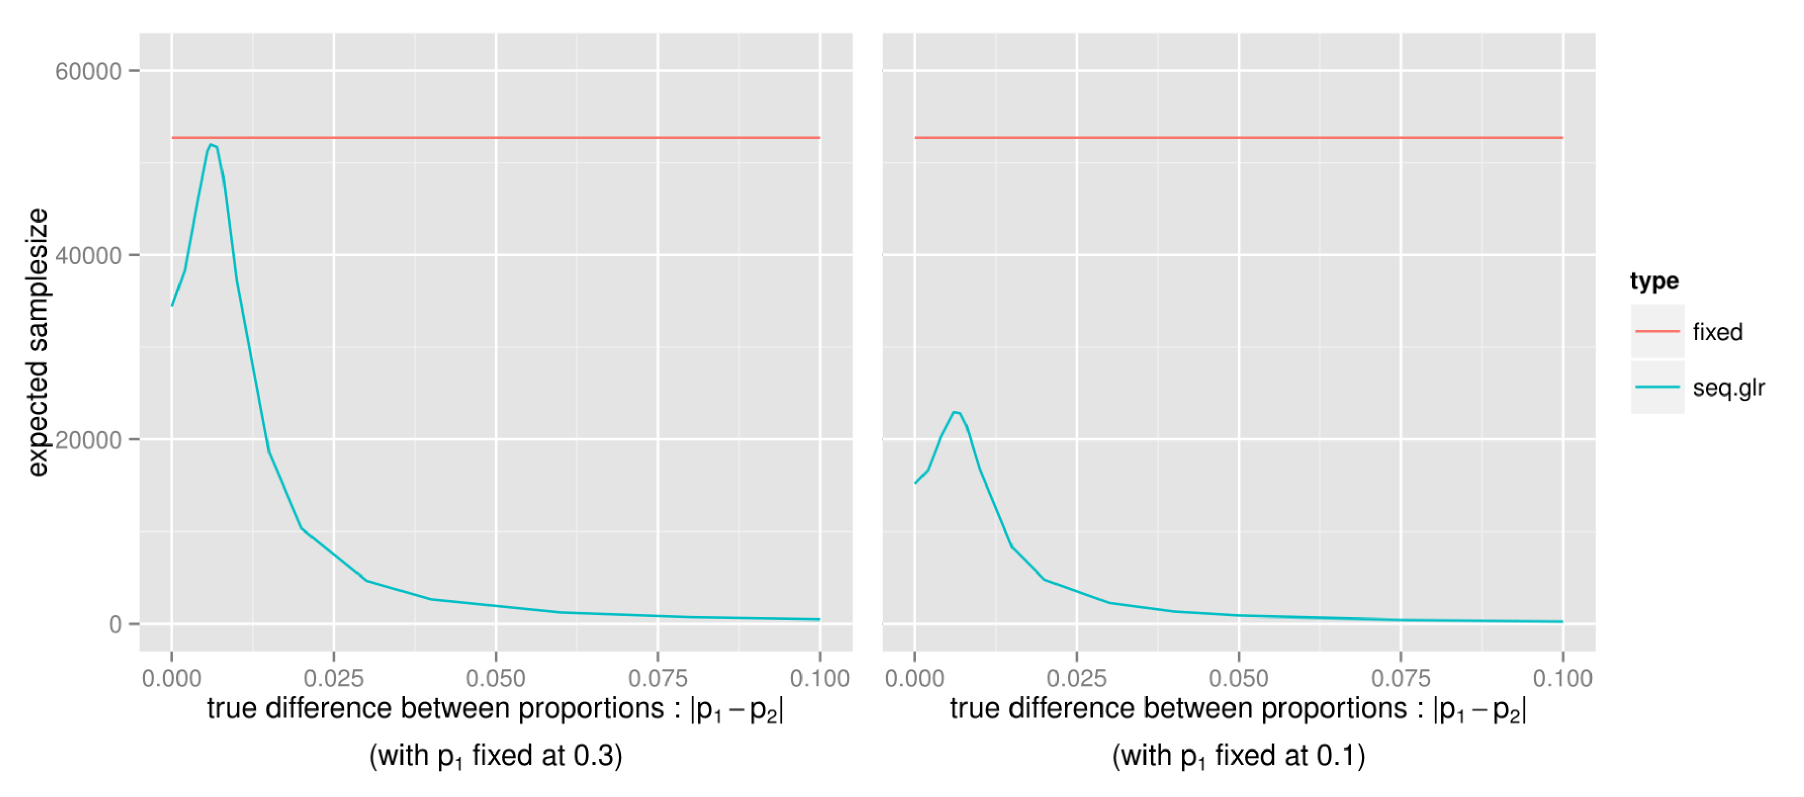
Actually, as the true p1 and p2 get closer to either 0 or 1, the expected samplesize will always be smaller than the fixed samplesize test. Since this is the expected samplesize, to be sure that the test doesn’t often require a much higher samplesize, let’s also take a look at the more extreme outcomes, for instance the 5th and 95th percentiles (with p1 and p2 close to 0.5 as earlier):
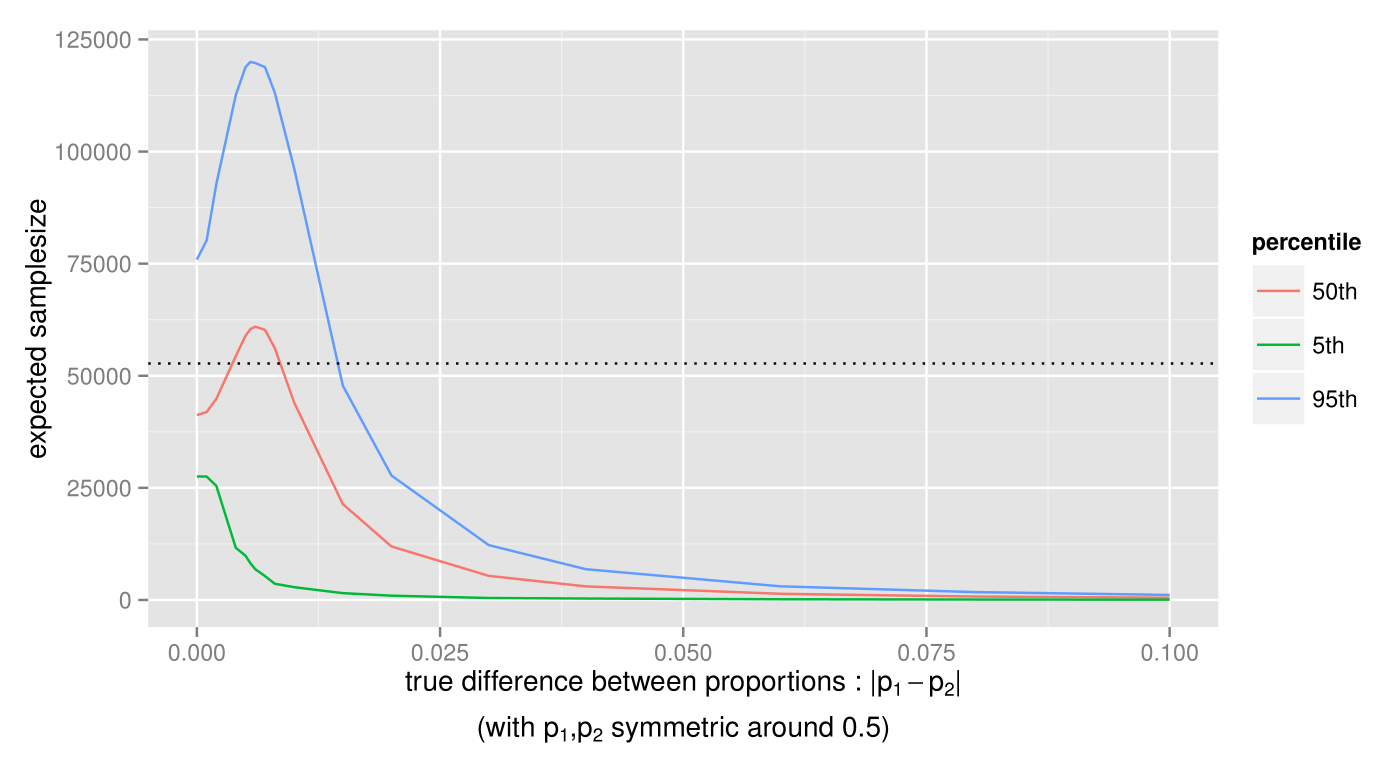
For most of the true differences the samplesize is still lower than the fixed-samplesize test, except for differences below 0.015. A good next question might be if there is a bound to the amount of samples we may have to collect? Actually, there exists a worst-case samplesize for the test, meaning that the test will always conclude before this point. In the example above, the worst-case samplesize, though extremely rare, is at 161103 samples. Note that there is a tradeoff between this worst-case samplesize and the size of the indifference region, which means that a smaller indifference region will lead to a larger worst-case samplesize, and a larger indifference region will lead to a smaller worst-case samplesize.
Given the very nice samplesize properties we’ve seen above, it might not come as a surprise that the sequential GLR test has been shown[1] to be the optimal test with regards to minimizing samplesize at a given α- and β-level.
[1] Theorem 5.4.1 in Tartakovsky et al, Sequential Analysis, CRC Press 2014
Usage
You can install SeGLiR, the node.js library I’ve implemented for doing these types of tests, via node package manager : `npm install seglir`. Here’s an example of how to set up and run a similar sequential GLR test as the one above in node.js.
var glr = require('seglir')
// set up an instance of a test, with indifference region of size 0.01,
//   alpha-level 0.05 and beta-level 0.10
var test = glr.test("bernoulli","two-sided",0.01,0.05,0.10)
When setting up any statistical hypothesis test, you need to calculate the test statistic thresholds at which the null-hypothesis or the alternative hypothesis is rejected for a given α- and β-level. Unfortunately, unlike the fixed samplesize tests, there is no analytical way to calculate these thresholds for the sequential GLR test, so SeGLiR will use simulation to find them. This simulation can take some time and doesn’t always converge, so I’ve added some precalculated thresholds for the most common levels. It probably saves a bit of time to check these precalculated thresholds in the reference before setting up a test.
Add data as it comes in, until the instance returns either “true” (the null hypothesis was accepted, i.e. there is no difference between the proportions) or “false” (the alternative hypothesis was accepted, i.e. there is a difference between the proportions).
test.addData({x:0,y:1})
test.addData({x:0})
test.addData({y:0})
test.addData({x:1,y:0})
// add more data until the function returns either "true" or "false"
When the test is done, you can get estimates of the true parameters by estimate():
test.estimate()
To get more details about functions, check out the SeGLiR reference. Try out comparing the fixed samplesize test and the sequential GLR yourself (using SeGLiR) in this demo.
To sum up, the sequential GLR test is an alternative to fixed samplesize tests that usually are much faster, at the cost of a large, but rare, worst-case samplesize. Another slight drawback with sequential tests is that post-analysis estimation can be a bit more tricky. I’ll elaborate on this in my next post, as well as talk a bit about the solutions I’ve implemented in SeGLiR. Follow me on twitter if you want to get updates!
If you’re interested in a very brief introduction to the mathematical details of the sequential GLR test, take a look at the SeGLiR reference. For a more rigorous mathematical introduction, see these excellent references:
- Tartakovsky, Nikiforov & Basseville : Sequential Analysis, CRC Press 2014
- Bartroff, Lai & Shih : Sequential Experimentation in Clinical Trials, Springer 2012