Peeking inside Convnets
Convolutional neural networks are used extensively for a number of image related tasks these days. Despite being very successful, they're mostly seen as "black box" models, since it's hard to understand what happens inside the network. There are however methods to "peek inside" the convnets, and thus understand a bit more about how they work.
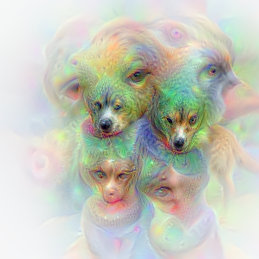
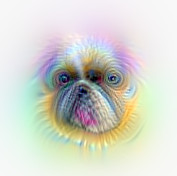
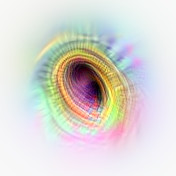
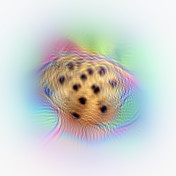
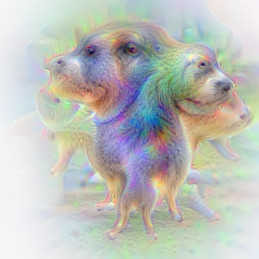
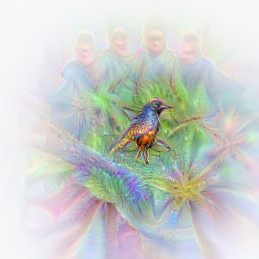
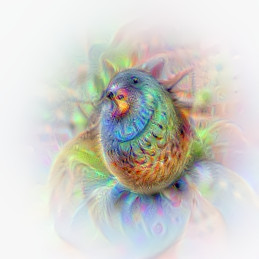
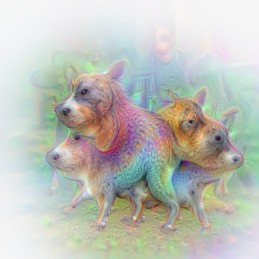
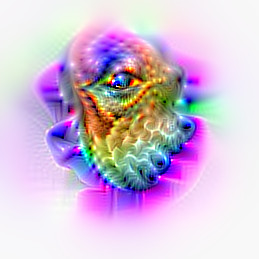
In a previous blogpost I showed how you could use gradient ascent, with some special tricks, to make a convolutional network visualize the classes it's learnt to classify. In this post I'll show that the same technique can also be used to "peek inside the network" by visualizing what the individual units in a layer detect. To give you an idea of the results, here's some highlights of visualizations of individual units from convolutional layer 5 in the VGG-S network:
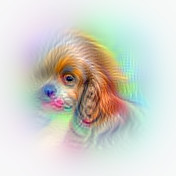
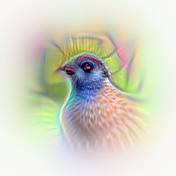
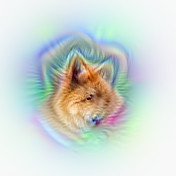
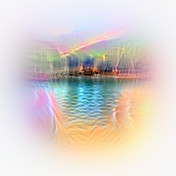
From top left we can pretty clearly see the head of a cocker spaniel-type dog, the head of some kind of bird, the ears of a canine, and a seaside coastline. Not all unit vizualisations are as clearly defined as these, but most nevertheless give us some interesting insights into what the individual units detect.
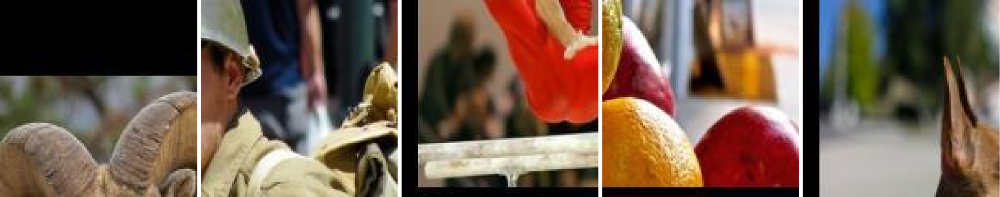
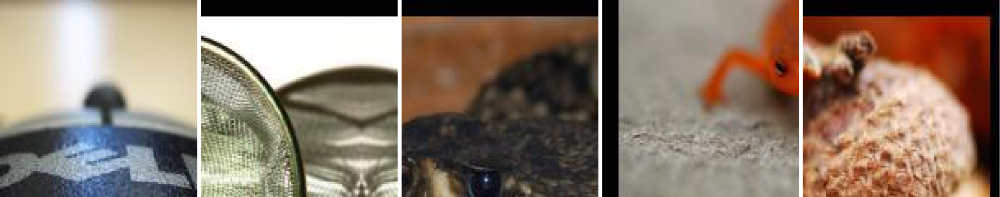
Earlier methods for figuring out what the units detect (e.g. in Zeiler & Fergus) have been to find images which maximally activate the individual units. Here's an example of the images (sampled from numerous crops of 100 000 images in the imagenet validation dataset) which give maximal activations for a specific unit in layer 5 of VGG-S:

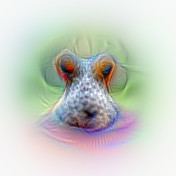
While this gives us an idea of what the unit is detecting, by visualizing the same unit we can see explicitly the details the unit is focusing on. Applying this technique to the same unit as above, we can see that the unit seems to focus on the characteristic pattern on the muzzle of the dog, seemingly ignoring most other details in the image.
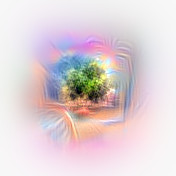
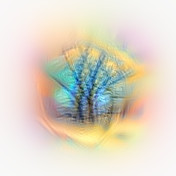
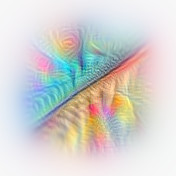
We can use our visualization technique to get an overview of what all the different units in a typical layer detects. Here we've focused on convolutional layer 5 in VGG-S, which is the final convolutional layer in that specific network. Seemingly there are a large number of units that detect very specific features, such as (from top left below) forests/bushes in the background, buildings with pitched roofs, individual trees, clouds, collars, brass instruments, ship masts, bottle/jug tops, and seemingly the shoulders of people:
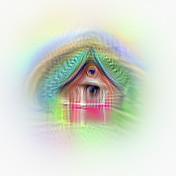
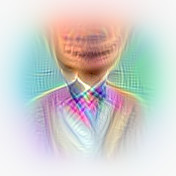


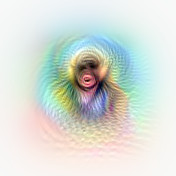
What is interesting to notice, is that the network doesn't seem to have learned detailed representations of faces. In e.g. the visualization featuring the collar, the face looks more like a spooky flesh-colored blob than a face. This might be an artifact of the visualization process, but it's not entirely unlikely that the network have either not found it necessary to learn the details, or not had the capacity to learn them.
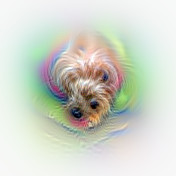
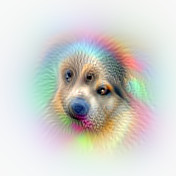
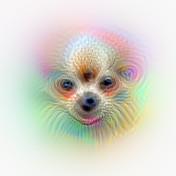
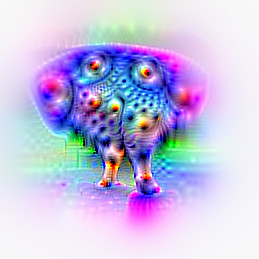
There also are a surprisingly large number of units that detect dog-related features. I counted somewhere around 50, out of 512 units in the layer in total, which means a surprising 10% of the network may be dedicated solely to dogs. Here's a small sample of these:
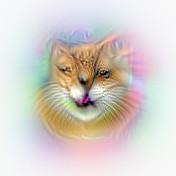
On the other hand I could only find a single unit that clearly detected cat features (!):
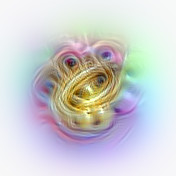
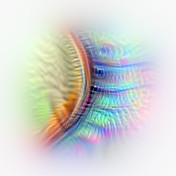
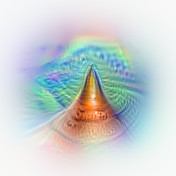
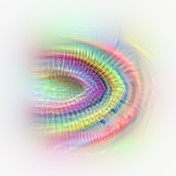
Some of the units are more general shape detectors, detecting edges, circles, corners, cones or similar:
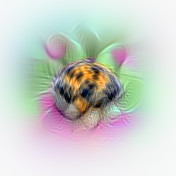
and some seem to detect textures, such as these detecting leopard fur and wood grain:
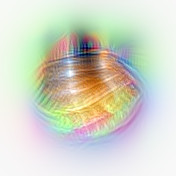
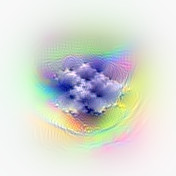
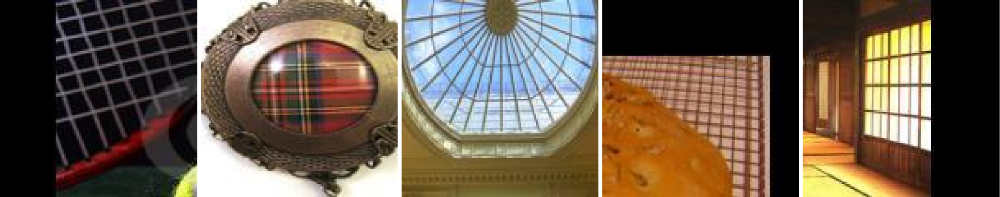
Not all of the unit visualizations are so easy to interpret, such as these:
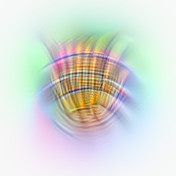
However, if we find images that maximally activate these units, we can see that they detect respectively grids and more abstract features such as out-of-focus backgrounds, and shallow-focus/macro images.
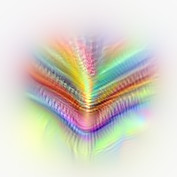
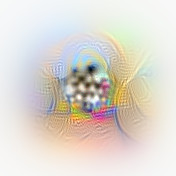
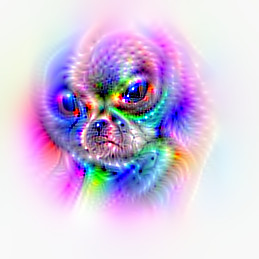
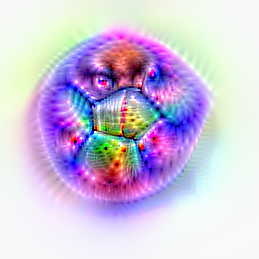
Overall, this visualization of the units give us useful insight into what the units in VGG-S detect. However, VGG-S is a relatively shallow network by todays standards, with only 5 convolutional layers. What about visualizing units in deeper networks, such as VGG-16 or GoogLeNet? Unfortunately, this doesn't seem to work as well, though it gives us some interesting results. Here for instance, is a visualization of some units in convolutional layer 4c from GoogLeNet:
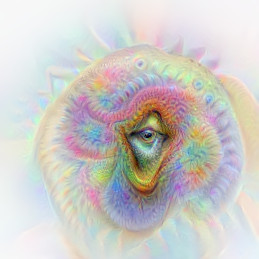
You might recognize some of these as the "puppyslugs" from DeepDream. While these visualization are more detailed than the ones we get from VGG-S, they also have a tendency to look more psychedelic and unreal. It is not completely clear why this happens, but it seems like the center of the visualization generally seems to be a good representation of what the unit detects, while the edges gives us lots of random details.
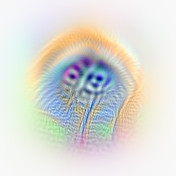
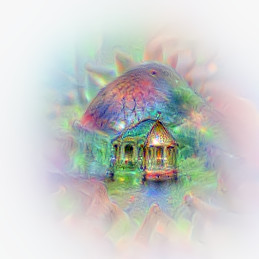
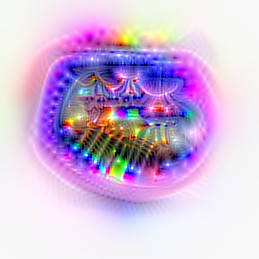
Similarly for VGG-16, the visualizations we get are much harder to interpret, though we can see in some of these that the unit seems to detect respectively some kind of dog, a theater and a brass instrument (with players as blobs).

A hypothetical reason that these visualizations doesn't work as well for deeper networks, has to do with the nature of the convolutional networks. What each convolutional layer tries to do is to be able to detect specific features, without being sensitive to irrelevant variations such as pose, lighting, partial obstruction etc. In this sense, each convolutional layer "compresses" information and throws away irrelevant details such as pose etc. This works great when doing detection, which is what the network is actually meant to do. However, when we try to run the network in reverse and generate feasible images, for each layer we have to "guess" the irrelevant structural details that have been thrown away, and as the choices made in one layer might not be coordinated with other layers, this in effect introduces some amount of "structural noise" for each layer we have to run in reverse. This might be a minor issue for networks with few layers, such as VGG-S, but as we introduce more and more layers, the cumulative "structural noise" might simply overpower the generated structure in the image, and make the image look much less like what we would recognize as e.g. a dog, and more like what we recognize as the "puppyslugs" seen in DeepDream.
More investigations might have to be done to tell whether this is actually the reason that visualization fails for deeper networks, but I wouldn't be surprised if this is part of the reason. Below I briefly describe the technical details of how I made these visualizations.
Technical details
To visualize the features, I'm using pretty much the same technique I described earlier in this blogpost, starting from a randomly initialized image, and doing gradient ascent on the image with regards to the activation of a specific unit. We also use blurring between gradient descent iterations (which is equivalent to regularization via a smoothness prior), and gradually reduce the "width" of the blur during gradient descent in order to get natural-looking images. Since units in intermediate layers actually output a grid of activations over the entire image, we choose to optimize a single point in this grid, which gives us a feature visualization corresponding to the units receptive field.
Another trick I also used, was to modify the network to use leaky ReLUs instead of regular ReLUs, since otherwise the gradient will usually be zero when we start from a blank image, thus hindering initial gradient ascent. Since this modification doesn't seem to have significant effect on the predictions of the network, we can assume it doesn't have a major impact on the feature visualizations.
I've released the code I used to make these visualizations, so take a look if you want to know more details.
Similar work
There has been similar work on visualizing convolutional networks by e.g. Zeiler and Fergus and lately by Yosinski, Nugyen et al. In a recent work by Nguyen, they manage to visualize features very well, based on a technique they called "mean-image initialization". Since I started writing this blog post, they've also published a new paper using Generative Adversarial Networks as priors for the visualizations, which lead to far far better visualizations than the ones I've showed above. If you are interested, do take a look at their paper or the code they've released!
If you enjoyed this post, you should follow me on twitter!